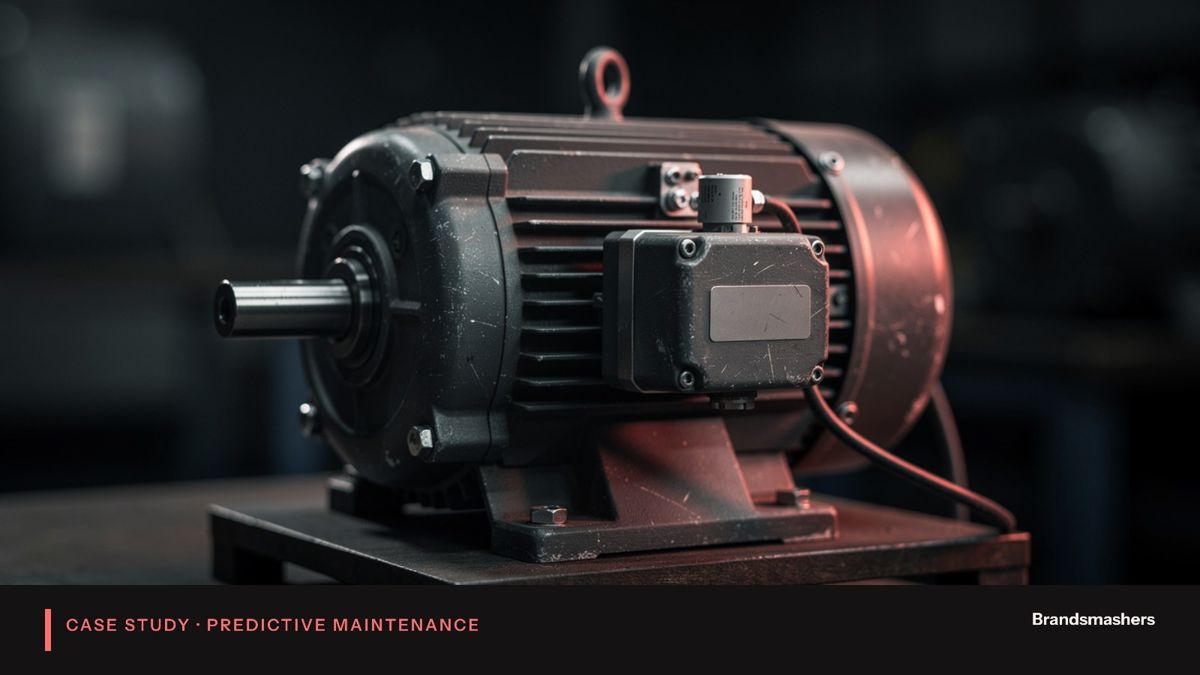
CASE STUDY · PREDICTIVE MAINTENANCE / INDUSTRIAL IOT
Building an IIoT dashboard that flagged a failure 3 weeks before it happened.
- 3 weeksA bearing issue flagged about 3 weeks ahead and replaced in planned downtime, avoiding an estimated 2 days of line stoppage
01 · PROJECT OVERVIEW
The client and the brief.
An anonymised mid-market B2B services company. Name withheld under confidentiality.
Alert rules on trend data and a machine-health dashboard. We chose to start with simple, readable rules rather than a complex model, because the client had little failure history to learn from.
- 1Failures arrived as surprises.
- 2Equipment that supported the client's operations stopped without notice, and the team learned about problems from the people affected.
- 3There was some machine data in controllers and logs, but nobody looked at trends.
- 4Maintenance was reactive, and each failure carried a cost in lost hours and rushed repairs.
02 · WHAT WENT WRONG
What went wrong, and how we fixed it.
Every engagement hits problems. These were the ones that mattered here, and what we changed so they did not come back.
- PROBLEM 01One sensor gave erratic readings for several days, and the dashboard showed the asset as unhealthy
The team lost time checking a machine that was fine. The cause was a loose mount, not a machine fault. We added a data-quality check that separates sensor problems from machine problems, such as impossible jumps and flat lines, and shows a "check sensor" state instead of a health alert.
- PROBLEM 02We also added a mounting check to the install steps
- PROBLEM 03The bearing warning itself came from a slow rise in vibration level over several weeks, with a smaller rise in temperature
No single reading crossed a limit. The trend rule caught what a fixed threshold would have missed. The maintenance lead checked the machine by hand, heard the change and ordered the part.
- PROBLEM 04The replacement was done in a planned stop, with the part already on site
03 · THE PROCESS
How we ran it.
The project was small and fast.
- 01Step 1
Discovery: we listed the assets that mattered most and the signals already available.
- 02Step 2
Data: we collected the existing readings into one place and cleaned them.
- 03Step 3
Rules and dashboard: we built trend views and alert rules with the maintenance lead, reviewed weekly.
- 04Step 4
Live watch: after launch, we checked alerts together twice a week until the team was confident.
We paired each alert with a written response step, so a warning always had a next action.
04 · RESULTS
What changed.
Measured against the way the work ran before the engagement began.
- NOW 01
The team reviews trends weekly instead of waiting for a failure.
- NOW 02
Repairs are scheduled in planned downtime.
- NOW 03
Spare parts for critical assets are held based on warnings.
- NOW 04
Sensor health is checked as part of routine maintenance.
- 3 weeks
A bearing issue flagged about 3 weeks ahead and replaced in planned downtime, avoiding an estimated 2 days of line stoppage
05 · WHAT WE BUILT
How it works.
- Readings from machine controllers and added sensors were collected through a gateway and stored with timestamps and asset IDs.
- Data was cleaned for gaps, spikes and unit mismatches before display.
- Baselines were set for each asset from its own normal operating range.
- Alert rules watched trends, not single readings: rate of change, sustained drift above baseline and growing variation.
- The dashboard showed each asset as a health state with a trend line, the last alert and the recommended step.
- Alerts were sent to the maintenance team and could be turned into work orders.
- Controls
- Each alert rule had a named owner, a review date and a record of every time it fired, with the outcome. Rules that fired often without a finding were reviewed and loosened or removed. Data was kept in the original form for later analysis, and access was limited by role. Gateways ran only the software we had approved, and updates went through a staged process.
06 · QUICK ANSWERS
The short version.
- What problem did the client have?
- Failures arrived as surprises. Equipment that supported the client's operations stopped without notice, and the team learned about problems from the people affected. There was some machine data in controllers and logs, but nobody looked at trends. Maintenance was reactive, and each failure carried a cost in lost hours and rushed repairs.
- What did Brandsmashers build?
- Alert rules on trend data and a machine-health dashboard. We chose to start with simple, readable rules rather than a complex model, because the client had little failure history to learn from.
- How was the work run?
- The project was small and fast.
- What were the results?
- A bearing issue flagged about 3 weeks ahead and replaced in planned downtime, avoiding an estimated 2 days of line stoppage.
YOUR TURN
Have a similar requirement?
Tell us what is stuck. We will come back with a plan and matched, pre-vetted engineers.