CASE STUDY · PREDICTIVE MAINTENANCE / INDUSTRIAL IOT
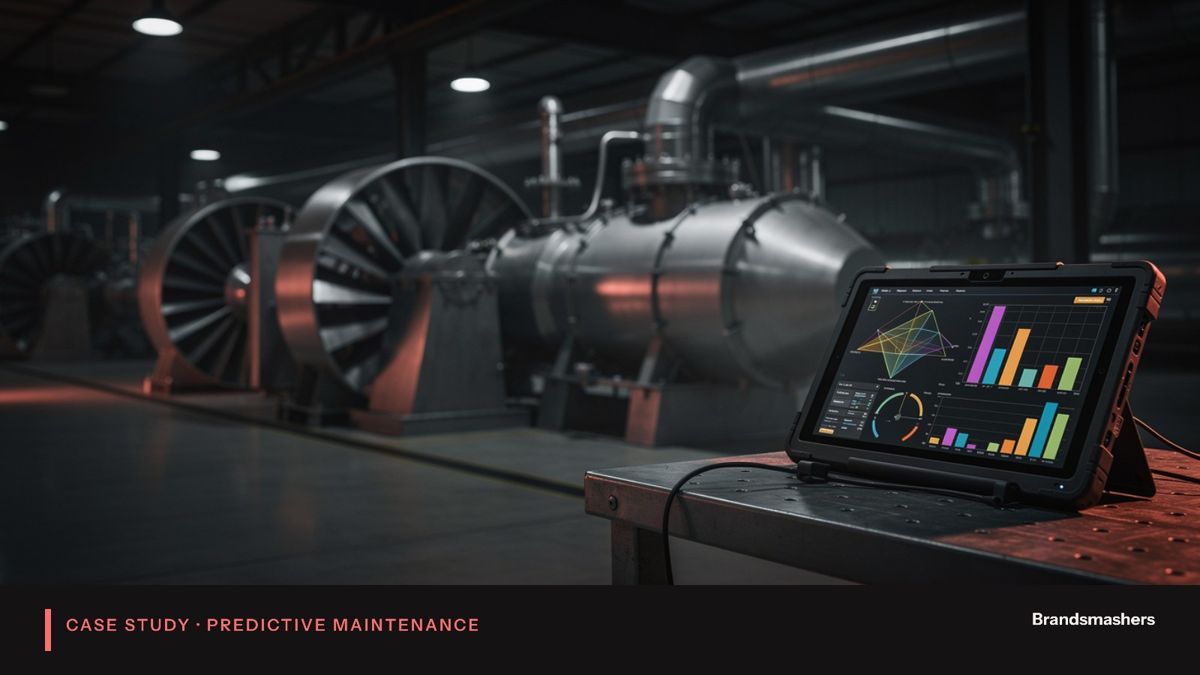
Predictive maintenance sensors across 40 factory machines.
- 30%Unplanned downtime down 30% in 6 months
01 · PROJECT OVERVIEW
The client and the brief.
An anonymised manufacturer. Name withheld under confidentiality.
Vibration and temperature sensors on 40 factory machines, a streaming pipeline and anomaly models, with a view for the maintenance team.
- 1Breakdowns and reactive maintenance.
- 2Machines on the production floor failed without warning, and each failure stopped work while teams hunted for parts and technicians.
- 3Fixed-interval servicing existed, but it did not match how the machines actually wore.
- 4Some parts were changed too early and others failed between visits.
- 5The plant had 40 machines in scope and no shared view of their condition.
02 · WHAT WENT WRONG
What went wrong, and how we fixed it.
Every engagement hits problems. These were the ones that mattered here, and what we changed so they did not come back.
- PROBLEM 01In the first weeks the alerts fired often and most were false
The models did not know when a machine changed product or speed, so a normal change looked like a fault. Technicians began to ignore the messages. We added operating mode as an input, pulled the production schedule into the pipeline and set a rule that an alert needed to persist over a window before it was raised.
- PROBLEM 02We also made technicians part of the tuning, asking them to mark each alert
False alerts dropped sharply and the team started to trust the system.
- PROBLEM 03A second hurdle was installation
Some mounting points were hot or oily, and adhesive sensors came loose within days. We moved to stud-mounted sensors where we could, cleaned the surface before fitting and added a mounting check to the weekly sensor report. Fitting was scheduled in short windows, so no machine stopped longer than it needed to.
- PROBLEM 04Fitting was scheduled in short windows, so no machine stopped longer than it needed to
03 · THE PROCESS
How we ran it.
We worked in stages across six months, with weekly sessions with the maintenance supervisors.
- 01Step 1
Survey: we reviewed breakdown history with the maintenance team and ranked machines by cost of stoppage and by failure type.
- 02Step 2
Pilot: we fitted sensors to a small group of machines, collected data and agreed what normal looked like.
- 03Step 3
Rollout: once alerts were trusted, we extended to all 40 machines in batches, scheduled around production.
- 04Step 4
Tuning: for the remaining months, we reviewed every alert with the team and marked it useful or not useful.
Daily messages flowed through a shared channel during installation. A monthly summary went to plant management.
04 · RESULTS
What changed.
Measured against the way the work ran before the engagement began.
- NOW 01
Maintenance is planned from machine condition, not only from the calendar.
- NOW 02
Technicians check the dashboard at the start of each shift.
- NOW 03
Parts are ordered when a warning appears, not after a failure.
- NOW 04
Every breakdown is reviewed to see whether a signal was missed, which improves the rules.
- 30%
Unplanned downtime down 30% in 6 months
Maintenance moved into planned windows
05 · WHAT WE BUILT
How it works.
- Vibration and temperature sensors were mounted near bearings, motors and gearboxes.Placement followed the failure history, not convenience.
- Sensors sent readings to local gateways, which buffered data when the network dropped and sent it on when it returned.
- A streaming pipeline carried readings to cloud storage with timestamps, machine IDs and sensor IDs.Bad readings, such as stuck values, were flagged.
- Features such as vibration energy by frequency band and temperature rise were computed per machine.
- Anomaly models compared each machine against its own baseline, adjusted for load and operating mode, so a machine running hard was not flagged just for working hard.
- Alerts had levels: watch, plan and act.Each level was linked to a response step agreed with maintenance.
- Controls
- Sensors were registered by serial number and checked weekly for silence, drift and battery level, so a dead sensor was replaced before it hid a fault. Alert rules were versioned, and every change was logged with a reason. Remote access to gateways used individual accounts with approval for any change to a production machine's configuration.
06 · QUICK ANSWERS
The short version.
- What problem did the client have?
- Breakdowns and reactive maintenance. Machines on the production floor failed without warning, and each failure stopped work while teams hunted for parts and technicians. Fixed-interval servicing existed, but it did not match how the machines actually wore. Some parts were changed too early and others failed between visits. The plant had 40 machines in scope and no shared view of their condition.
- What did Brandsmashers build?
- Vibration and temperature sensors on 40 factory machines, a streaming pipeline and anomaly models, with a view for the maintenance team.
- How was the work run?
- We worked in stages across six months, with weekly sessions with the maintenance supervisors.
- What were the results?
- Unplanned downtime down 30% in 6 months; maintenance moved into planned windows.
YOUR TURN
Have a similar requirement?
Tell us what is stuck. We will come back with a plan and matched, pre-vetted engineers.